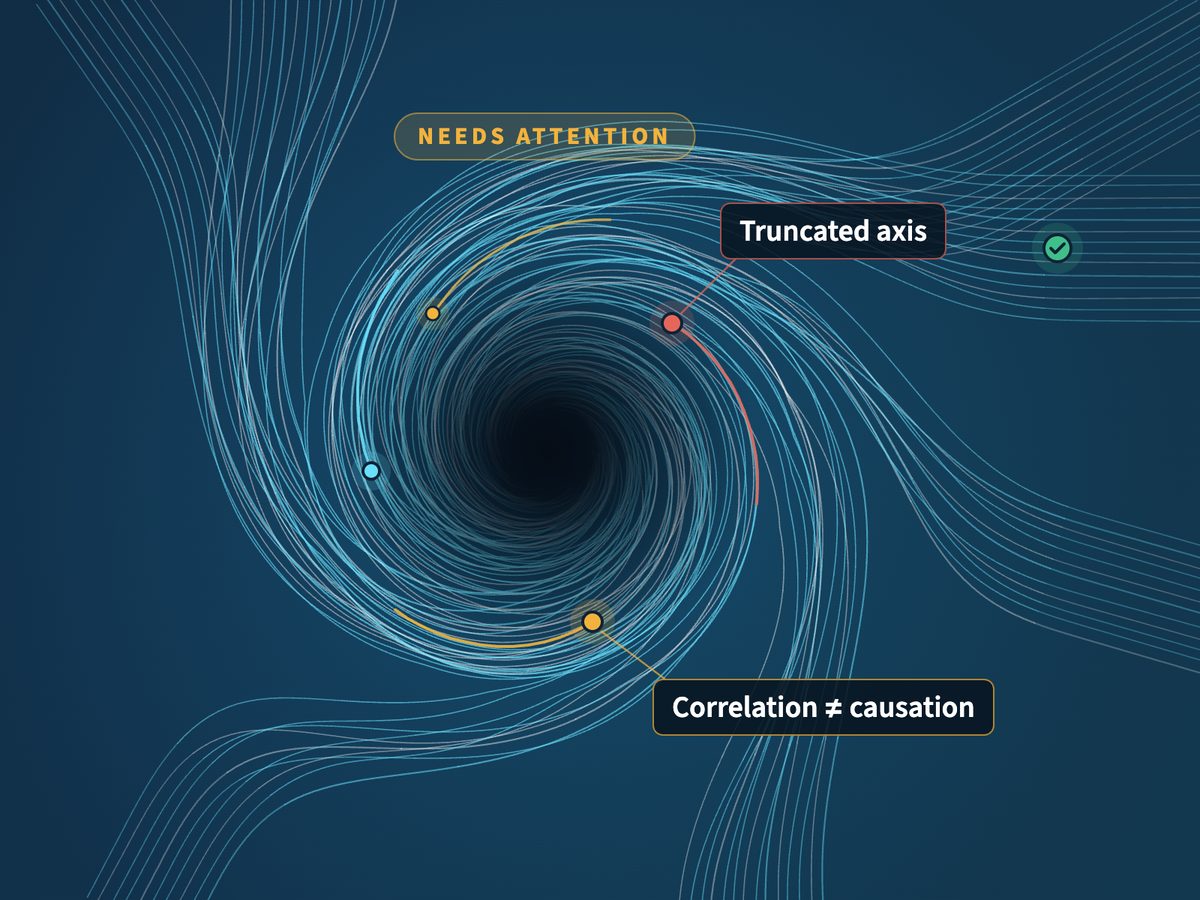
From the book by Ben Jones 78 pitfalls

DATA
PITFALLS

Spot them · Name them · Fix them

The common mistakes that mislead in charts, dashboards, SQL and reports, made by humans and AI alike.

One taxonomy of 78 pitfalls across eight domains, from Avoiding Data Pitfalls (Wiley). Read it, put it inside Claude, or run it on your own work in the Data Literacy Lab.

In ClaudeFree

Data Pitfalls MCP

Give Claude the full checklist. Ask it to review a chart, a query or a dashboard, and it checks the work against every rule and names each finding.

  • Works in claude.ai and Claude Code
  • No API key and no sign-up
  • Free to use at work; code on GitHub and npm
In the LabPro

Pitfalls Detector

Upload a chart, a deck, code or a write-up and get a reviewer’s report back: a verdict, the one thing to fix first, and what you already did well.

  • Up to four charts checked together
  • Sample reports on real published charts
  • Part of the Data Literacy Lab
On paperBook

Avoiding Data Pitfalls

The book the rules come from: how to steer clear of common blunders when working with data, with the stories behind each one.

  • Ben Jones, Wiley, 2019
  • Seven chapters of pitfalls
  • Paperback and ebook

Put the checklist inside Claude

The Data Pitfalls MCP is a free connector. It doesn’t run anything on your work or see your data. It hands Claude the rules, and Claude does the checking in your own chat.

  1. In claude.ai, open Settings → Connectors, choose Discover and search for Data Pitfalls.
  2. Choose Connect. There’s no sign-in.
  3. In any chat, ask: “Check this chart for data pitfalls.”
Or add it as a custom connector with this URL:
https://www.avoidingdatapitfalls.com/api/mcp
get_checklist
The rules for a chart, SQL, dashboard or report
get_pitfall
One rule in full, with examples
search_pitfalls
Find rules by topic
list_pitfalls
All the rules, by domain

More detail in the connector setup guide. Source on GitHub.

Example in ClaudeData Pitfalls
Here’s our quarterly sales chart for the board deck. Anything misleading?
Data Pitfalls · get_checklist(chart)
Truncated Y-Axis truncated-y-axis
The bars start at $40M, so Q4 looks three times taller than Q1 for a 12% gain. Start the axis at zero, or switch to a line or dot plot.
Cherry-Picked Chart Window cherry-picked-chart-window
Only four quarters are shown. Add last year so the board can see whether Q4 is seasonal.
An illustration of a review. Rules from Avoiding Data Pitfalls by Ben Jones.

Run the detector from your terminal

The datapitfalls command-line tool scans a chart image, a code file, a PDF, Word or PowerPoint document, or a plain-English description, and reports what is wrong, why it matters and how to fix it. It runs on your own Claude API key, so it works in scripts, CI pipelines and coding agents too.

  1. Set your Anthropic API key (Node.js 18 or later):
    export ANTHROPIC_API_KEY="sk-ant-..."
  2. Scan a file:
    npx datapitfalls scan ./chart.png
  3. Or describe an analysis in words:
    npx datapitfalls scan --text notes.txt
--all
Every finding, including lower-confidence latent ones
--thorough
Use the deepest model
--json
Machine-readable findings for agents and scripts
--ci
Exit non-zero when a blocking pitfall is found

Run npx datapitfalls --help for every option. Scans send your file to the Claude API under your key. Package on npm, source on GitHub.

For teams

Train your team to avoid them

Claude can catch a pitfall after the fact. A trained team doesn’t make it in the first place. Data Literacy runs Data Pitfalls workshops and expert reviews of your dashboards and reports, built on the book.

Cover of Avoiding Data Pitfalls by Ben Jones
The book

Where the rules come from

Ben Jones wrote Avoiding Data Pitfalls: How to Steer Clear of Common Blunders When Working with Data and Presenting Analysis and Visualizations (Wiley, 2019). The taxonomy behind the connector and the Lab detector is built directly from its chapters.